Introduction
In this notebook/document we apply the monad QRMon [3] over data of the article [1]. In order to get the data we use extraction procedure described in [2].
(I saw the article [1] while browsing LinkedIn today. I met one of the authors during the event "Data Science Salon Miami Feb 2018".)
Extract data
I extracted the data from the image using "Recovering data points from an image".
img = Import["https://www.spglobal.com/_assets/images/marketintelligence/blog-images/demonstration-of-model-fit-comparison-visualization.png"]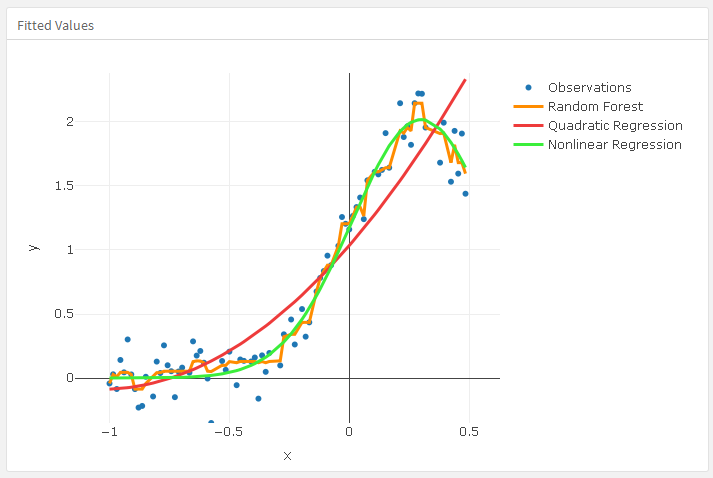
enter image description here
extractedData
(* {{-1., 0.284894}, {-0.987395, 0.340483}, {-0.966387,
  0.215408}, {-0.941176, 0.416918}, {-0.894958, 0.222356}, {-0.890756,
   0.215408}, {-0.878151, 0.0903323}, {-0.848739,
  0.132024}, {-0.844538, 0.10423}, {-0.831933, 0.333535}, {-0.819328,
  0.180665}, {-0.781513, 0.423867}, {-0.756303, 0.40997}, {-0.752101,
  0.528097}, {-0.747899, 0.416918}, {-0.731092, 0.375227}, {-0.714286,
   0.194562}, {-0.710084, 0.340483}, {-0.651261,
  0.555891}, {-0.647059, 0.333535}, {-0.605042, 0.496828}, {-0.57563,
  0.}, {-0.512605, 0.354381}, {-0.491597, 0.368278}, {-0.487395,
  0.472508}, {-0.478992, 0.479456}, {-0.453782, 0.437764}, {-0.357143,
   0.15287}, {-0.344538, 0.340483}, {-0.331933, 0.333535}, {-0.315126,
   0.500302}, {-0.285714, 0.396073}, {-0.247899,
  0.618429}, {-0.201681, 0.541994}, {-0.159664, 0.680967}, {-0.10084,
  1.06314}, {-0.0966387, 0.993656}, {0., 1.36193}, {0.0210084,
  1.44532}, {0.0420168, 1.5148}, {0.0504202, 1.5148}, {0.0882353,
  1.41405}, {0.130252, 1.70937}, {0.172269, 2.029}, {0.176471,
  1.7858}, {0.222689, 2.20272}, {0.226891, 2.23746}, {0.231092,
  2.23746}, {0.239496, 1.96647}, {0.268908, 1.94562}, {0.273109,
  1.91088}, {0.277311, 1.91088}, {0.281513, 1.94562}, {0.294118,
  2.2861}, {0.319328, 2.26526}, {0.327731, 2.3}, {0.432773,
  1.68157}, {0.462185, 1.86918}, {0.5, 2.00121}} *)

ListPlot[extractedData, PlotRange -> All, PlotTheme -> "Detailed"]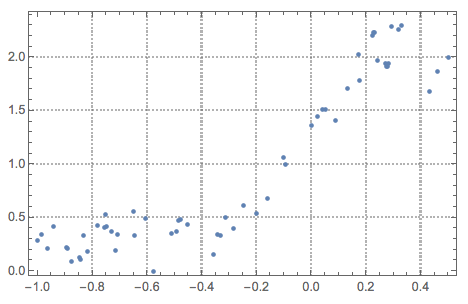
enter image description here
Apply QRMon
Load packages. (For more details see [4].)
Import["https://raw.githubusercontent.com/antononcube/\
MathematicaForPrediction/master/MonadicProgramming/\
MonadicQuantileRegression.m"]
Import["https://raw.githubusercontent.com/antononcube/\
MathematicaForPrediction/master/MonadicProgramming/MonadicTracing.m"]
Apply the QRMon workflow within the TraceMonad:
TraceMonadUnit[QRMonUnit[extractedData]]⟹"lift data to the monad"⟹
  QRMonEchoDataSummary⟹"echo data summary"⟹
  QRMonQuantileRegression[12, 0.5]⟹"do Quantile Regression with\nB-spline basis with 12 knots"⟹
  QRMonPlot⟹"plot the data and regression curve"⟹
  QRMonEcho[Style["Tabulate QRMon steps and explanations:", Purple, Bold]]⟹"echo an explanation message"⟹
  TraceMonadEchoGrid;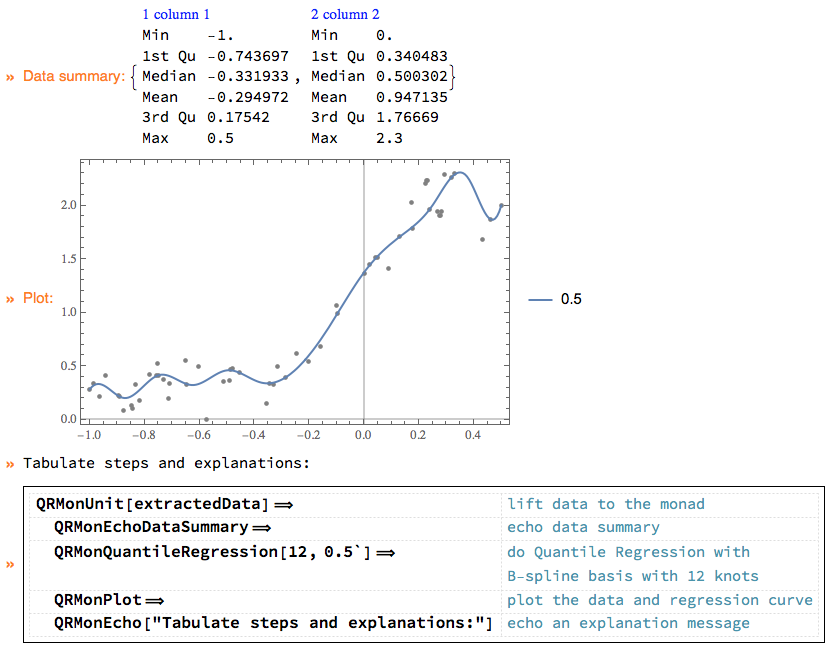
enter image description here
References
[1] Moody Hadi and Danny Haydon, "A Perspective On Machine Learning In Credit Risk", (2018), S&P Global Market Intelligence.
[2] Andy Ross, answer of "Recovering data points from an image", (2012).
[3] Anton Antonov, "A monad for Quantile Regression workflows", (2018), MathematicaForPrediction at WordPress.
[4] Anton Antonov, "Monad code generation and extension", (2017), MathematicaForPrediction at GitHub*,https://github.com/antononcube/MathematicaForPrediction.
