Introduction
This blog post is with the slides of my lighting talk for the useR! 2020 Conference, St. Louis, USA.
Here is the video recording:
How to simplify Machine Learning workflows specifications?
useR! 2020 Conference, lightning talk
Anton Antonov
Senior Research Scientist
Accendo Data LLC
https://github.com/antononcube

What is this about?
Rapid specification of Machine Learning (ML) workflows using natural language commands.
The easiest things to automate with ML are ML workflows.
This presentation demonstrates that with natural language interfaces to ML algorithms.
Motivation
Assume that:
- We want to create conversation agents that help Data Science (DS) and ML practitioners to quickly create first, initial versions of different DS and ML workflows for different programming languages and related packages.
- We expect that the initial versions of programming code are tweaked further. (In order to produce desired outcomes in the application area of interest.)
The workflows considered
In this presentation we focus on these three ML areas:
- Quantile Regression (QR)
- Latent Semantic Analysis (LSA)
- Recommendations
First example data
Assume we have a data frame with temperature data. Here is a summary:
##       Time            Temperature
##  Min.   :3.629e+09   Min.   : 4.72
##  1st Qu.:3.661e+09   1st Qu.:19.67
##  Median :3.692e+09   Median :23.33
##  Mean   :3.692e+09   Mean   :22.28
##  3rd Qu.:3.724e+09   3rd Qu.:26.11
## Max. :3.755e+09 Max. :31.17ggplot2::ggplot(dfTemperatureData) + ggplot2::geom_point( ggplot2::aes( x = Time, y = Temperature ) )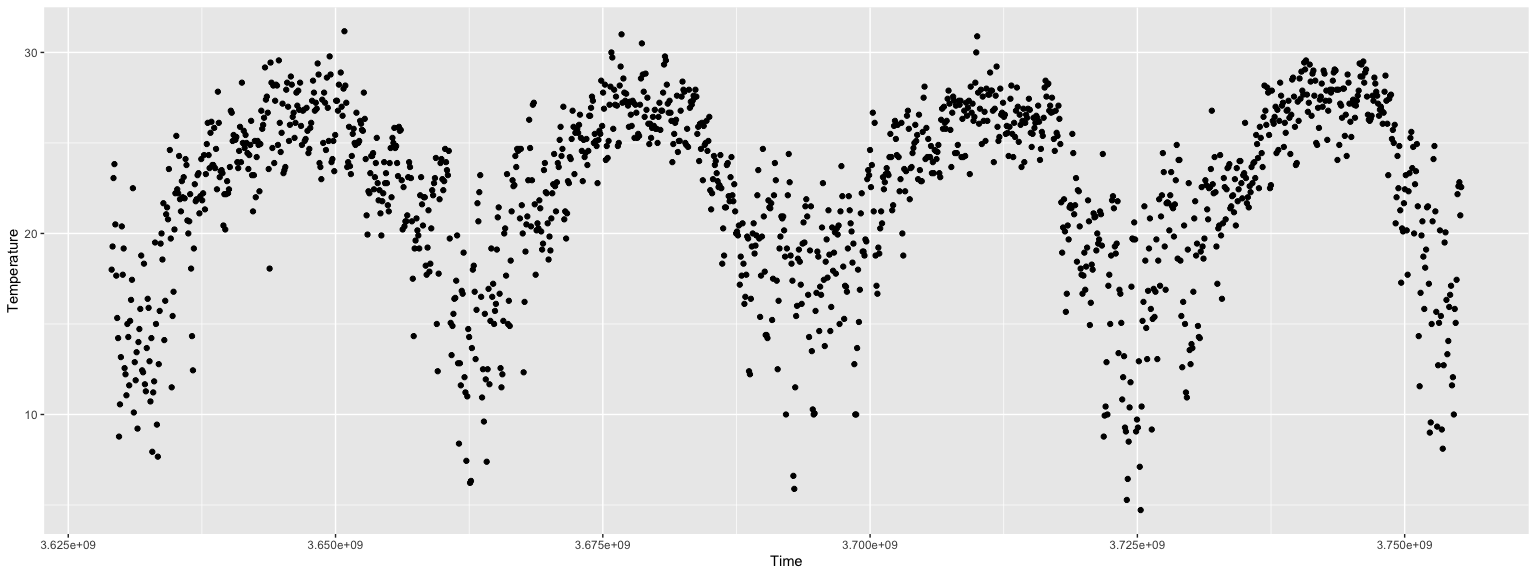
Quantile Regression workflow: first example
Here is a Quantile Regression (QR) workflow specification:
qrmon2 <-
  eval( expr = to_QRMon_R_command(
    "create from dfTemperatureData;
     compute quantile regression with 12 knots and probabilities 0.25, 0.5, and 0.75;
     show date list plot with date origin 1900-01-01;", parse = TRUE) )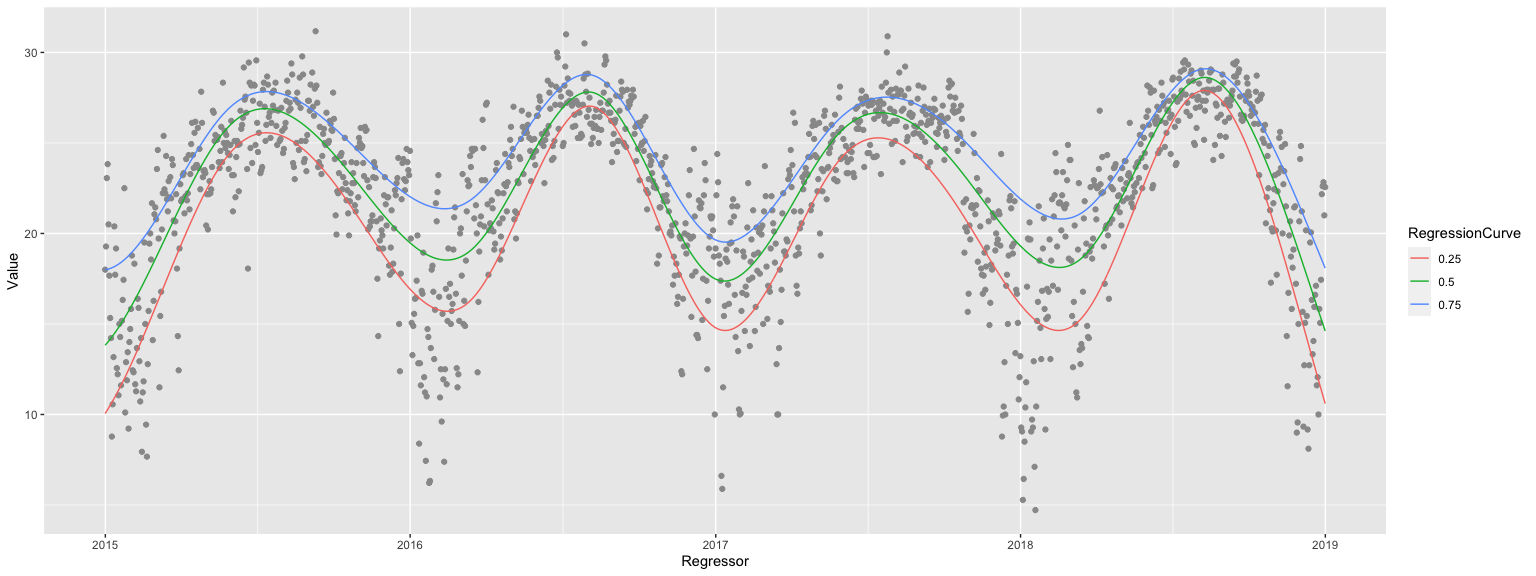
How it is done?
For a given ML domain (like QR or LSA) we create two types of Domain Specific Languages (DSL’s):
- a software monad (i.e. programming language pipeline package) and
- a DSL that is a subset of a spoken language.
These two DSL’s are combined: the latter translates natural language commands into the former.
By executing those translations we interpret commands of spoken DSL’s into ML computational results.
Note, that we assume that there is a separate system that converts speech into text.
Development cycle
Here is a clarification diagram:

Grammars and parsers
For each type of workflow is developed a specialized DSL translation Raku module.
Each Raku module:
- Has grammars for parsing a sequence of natural commands of a certain DSL
- Translates the parsing results into corresponding software monad code
Different programming languages and packages can be the targets of the DSL translation.
(At this point are implemented DSL-translators to Python, R, and Wolfram Language.)
Here is an example grammar.
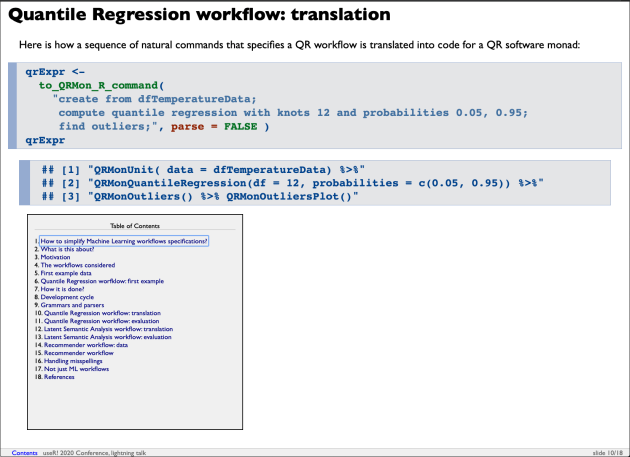
Quantile Regression workflow: translation
Here is how a sequence of natural commands that specifies a QR workflow is translated into code for a QR software monad:
qrExpr <-
  to_QRMon_R_command(
    "create from dfTemperatureData;
     compute quantile regression with knots 12 and probabilities 0.05, 0.95;
     find outliers;", parse = FALSE )
qrExpr
## [1] "QRMonUnit( data = dfTemperatureData) %>%"
## [2] "QRMonQuantileRegression(df = 12, probabilities = c(0.05, 0.95)) %>%"
## [3] "QRMonOutliers() %>% QRMonOutliersPlot()"Quantile Regression workflow: evaluation
Here we evaluate the generated QR monad code:
## Warning in QRMonSetData(res, data): The argument data is expected to be a data frame with columns: { Regressor, Value }.## Warning in QRMonSetData(res, data): Proceeding by renaming the first columm "Time" as "Regressor" and renaming the second columm "Temperature" as "Value".
Latent Semantic Analysis workflow: translation
Here is how a sequence of natural commands that specifies a LSA workflow is translated into code for a LSA software monad:
lsaExpr <-
  to_LSAMon_R_command(
    "create from textHamlet;
     make document term matrix with automatic stop words and without stemming;
     apply lsi functions global weight function idf, local term weight function none, normalizer function cosine;
     extract 12 topics using method SVD, max steps 120, and min number of documents per term 2;
     show thesaurus table for ghost and grave;", parse = FALSE  )
lsaExpr
## [1] "LSAMonUnit(textHamlet) %>%"
## [2] "LSAMonMakeDocumentTermMatrix( stopWords = NULL, stemWordsQ = FALSE) %>%"
## [3] "LSAMonApplyTermWeightFunctions(globalWeightFunction = \"IDF\", localWeightFunction = \"None\", normalizerFunction = \"Cosine\") %>%"
## [4] "LSAMonExtractTopics( numberOfTopics = 12, method = \"SVD\", maxSteps = 120, minNumberOfDocumentsPerTerm = 2) %>%"
## [5] "LSAMonEchoStatisticalThesaurus( words = c(\"ghost\", \"grave\"))"Latent Semantic Analysis workflow: evaluation
Here we execute the generated LSA monad code:
## Warning in NonNegativeMatrixFactorization::NearestWords(lsaObj$H, word, : More that one column name corresponds to the search word; the first match is used.## SearchTerm Word.Distance Word.Index Word.Word
## 1 ghost 0.0000000000 623 ghost
## 2 ghost 2.7104582353 27 again
## 3 ghost 3.0323549513 513 father
## 4 ghost 3.1750339154 1465 stage
## 5 ghost 3.2285642571 1644 under
## 6 ghost 3.2393248725 319 cries
## 7 ghost 3.3826537734 1312 s
## 8 ghost 3.4975768169 1512 swear
## 9 ghost 3.5204077364 935 mar
## 10 ghost 3.5868377279 1550 thee
## 11 ghost 3.5869119178 744 hor
## 12 ghost 3.5901934408 1587 thy
## 13 grave 0.0000000000 648 grave
## 14 grave 0.0002598782 1597 tongue
## 15 grave 0.0002828355 151 better
## 16 grave 0.0002891626 1317 said
## 17 grave 0.0003122740 741 honour
## 18 grave 0.0003327156 1419 sleep
## 19 grave 0.0003395627 897 long
## 20 grave 0.0003459771 60 any
## 21 grave 0.0004090686 1251 reason
## 22 grave 0.0004264220 58 answer
## 23 grave 0.0004381933 643 grace
## 24 grave 0.0004560758 429 eachRecommender workflow: data
Consider the making of a recommender over the Titanic data:
##           id passengerClass passengerAge passengerSex passengerSurvival
## 1225 id.1225            3rd           20         male              died
## 443   id.443            2nd           20         male              died
## 761   id.761            3rd           30         male          survived
## 835   id.835            3rd           30         male              died
## 706   id.706            3rd           -1         male              died
## 339   id.339            2nd           30         male              died
## 515   id.515            2nd            0         male          survived
## 10     id.10            1st           70         male              died
## 579   id.579            2nd           30         male              died
## 1248 id.1248            3rd           -1       female          survived
## 673   id.673            3rd           -1         male              died
## 1205 id.1205 3rd 20 male died## id passengerClass passengerAge passengerSex passengerSurvival
## id.1 : 1 1st:323 Min. :-1.00 female:466 died :809
## id.10 : 1 2nd:277 1st Qu.:10.00 male :843 survived:500
## id.100 : 1 3rd:709 Median :20.00
## id.1000: 1 Mean :23.55
## id.1001: 1 3rd Qu.:40.00
## id.1002: 1 Max. :80.00
## (Other):1303Recommender workflow
Here are recommender workflow specification and evaluation results:
smrmon2 <-
  eval( expr = to_SMRMon_R_command(
    "create from dfTitanic;
     apply the LSI functions inverse document frequency, term frequency, and cosine;
     compute the top 6 recommendations for the profile female=1, 30=1;
     extend recommendations with dfTitanic;
     show pipeline value", parse = TRUE ) )
## Score Index id passengerClass passengerAge passengerSex passengerSurvival
## 1 2 1 id.1 1st 30 female survived
## 2 2 33 id.1027 3rd 30 female survived
## 3 2 68 id.1059 3rd 30 female died
## 4 2 72 id.1062 3rd 30 female survived
## 5 2 99 id.1087 3rd 30 female died
## 6 2 108 id.1095 3rd 30 female survivedHandling misspellings
The approach taken in the design and implementation of the natural language commands interpreters can handle misspellings:
smrmon2 <-
eval( expr = to_SMRMon_R_command(
"create from dfTitanic;
aply the LSI functions inverse document frequency, term frequency, and cosine;
compute the top 6 recomendations for the profle female=1, 30=1;
extend recommendations with dfTitanic;
show pipeline value" ) )## [1] "Possible misspelling of 'apply' as 'aply'."
## [2] "Possible misspelling of 'recommendations' as 'recomendations'."
## [3] "Possible misspelling of 'profile' as 'profle'."
##   Score Index      id passengerClass passengerAge passengerSex passengerSurvival
## 1     2     1    id.1            1st           30       female          survived
## 2     2    33 id.1027            3rd           30       female          survived
## 3     2    68 id.1059            3rd           30       female              died
## 4     2    72 id.1062            3rd           30       female          survived
## 5     2    99 id.1087            3rd           30       female              died
## 6 2 108 id.1095 3rd 30 female survivedNot just ML workflows
Obviously this approach can be used for any type of computational workflows.
Here is an example of an Epidemiology Modeling workflow:
ecmCommands <-
'create with the model susceptible exposed infected two hospitalized recovered;
 assign 100000 to the susceptible population;
 set infected normally symptomatic population to be 0;
 set infected severely symptomatic population to be 1;
 assign 0.56 to contact rate of infected normally symptomatic population;
 assign 0.58 to contact rate of infected severely symptomatic population;
 assign 0.1 to contact rate of the hospitalized population;
 simulate for 240 days;
plot populations results;'## expression(
## ECMMonUnit(model = SEI2HRModel()) %>%
## ECMMonAssignInitialConditions(initConds = c(SPt = 1e+05)) %>%
## ECMMonAssignInitialConditions(initConds = c(INSPt = 0)) %>%
## ECMMonAssignInitialConditions(initConds = c(ISSPt = 1)) %>%
## ECMMonAssignRateValues(rateValues = c(contactRateINSP = 0.56)) %>%
## ECMMonAssignRateValues(rateValues = c(contactRateISSP = 0.58)) %>%
## ECMMonAssignRateValues(rateValues = c(contactRateHP = 0.1)) %>%
## ECMMonSimulate(maxTime = 240) %>% ECMMonPlotSolutions(stocksSpec = ".*Population")
## )
References
Repositories
[AAr1] Anton Antonov, R-packages, (2019), GitHub.
[AAr2] Anton Antonov, Conversational Agents, (2017), GitHub.
Packages
[AAp1] Anton Antonov, Quantle Regression Monad in R, (2019), GitHub.
[AAp2] Anton Antonov, Latent Semantic Analysis Monad in R, (2019), R-packages at GitHub.
[AAp3] Anton Antonov, Sparse Matrix Recommender Monad in R, (2019), R-packages at GitHub.
[AAp4] Anton Antonov, Epidemiology Compartmental Modeling Monad in R, (2020), GitHub.
